
The true affinity of anti-dsDNA antibodies as biomarker offers a new way to read Lupus activity.
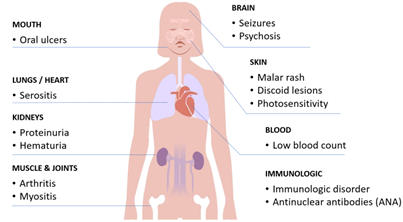
Systemic lupus erythematosus (SLE) is a notoriously complex autoimmune disease. For some patients, lupus remains relatively mild and manageable. For others, it can progress into a severe and even life-threatening condition, such as lupus nephritis (LN), where the kidneys become inflamed and damaged. As a result, detection of lupus nephritis still relies heavily on renal biopsy.
Clinicians have long relied on blood biomarkers to help diagnose the disease, but the striking variability in clinical symptoms between patients and the results from commercial assays still makes lupus difficult to monitor and to predict the prognosis. Among the most specific and widely used are antibodies against double-stranded DNA, known as anti-dsDNA antibodies. High levels of these antibodies and depletion of the C3 complement protein are often associated with disease flares and, in particular, kidney involvement. However, as shown in this study, current static endpoint measurement of anti-dsDNA tests still show poor correlation with progression and disease severity.
And here is the catch: antibody levels alone don’t tell the full story.
Why anti-dsDNA antibodies matter – and where the detection falls short
In daily clinical practice, anti-dsDNA antibody testing can be frustratingly inconsistent. Different laboratory methods often produce conflicting results, both in patients with early symptoms and in those already diagnosed and monitored over time.
One reason lies in the nature of the antibodies themselves. Anti-dsDNA antibodies are highly heterogeneous: they may recognise different regions (epitopes) of DNA, and different assays are designed to detect different subsets of these antibodies. Some tests claim to preferentially detect low-avidity antibodies, while others are more sensitive to high-avidity ones — the latter being more closely linked to disease severity.
What none of these standard endpoint tests truly capture, however, is true antibody affinity: how fast antibodies bind to DNA, how tightly they bind, and how long they stay bound. This disconnect raises an important question: What if the quality of antibody binding matters just as much as the quantity?
Real-time binding kinetics for auto-antibodies
A recent study conducted by the immunology laboratory of CHU Brugmann, with the development support and technology of Vixen Bio, introduces a new way of answering that question.
Using a real-time binding assay, the researchers analysed anti-dsDNA antibodies directly in patient serum. Instead of producing a single endpoint value, this approach generates full kinetic profiles, revealing how antibodies interact with dsDNA over time.
The study compared sera from different patient and control groups and this allowed to examine not just whether antibodies were present, but specifically how they interact with dsDNA and how this correlates to the disease activity.
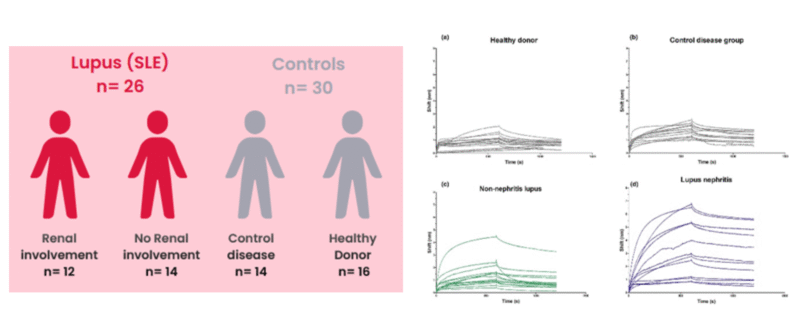
Figure 1: Tested cohort consisting of SLE and LN patient samples and disease and healthy control samples that resulted in the distinct kinetic curves.
How affinity maturation reflects disease severity
The results were striking. Patients with severe lupus nephritis tended to have anti-dsDNA antibodies that bound DNA more rapidly and more stably, with slower dissociation rates. In contrast, patients with milder disease showed weaker and more transient interactions.
Crucially, these differences were not always visible in conventional antibody titre measurements, such as those obtained with chemiluminescence immunoassays (CLIA). Two patients could show similar anti-dsDNA levels, yet have antibodies with very different kinetic behaviours – and very different clinical outcomes.
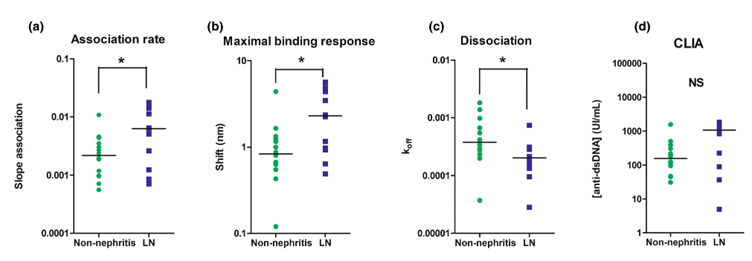
Figure 2: Comparison of anti-dsDNA autoantibody levels and kinetic parameters between non-nephritis lupus and LN patients, where (a) shows the initial slope of the association rate where LN patients exhibit a significant steeper slope; (b) shows the maximum binding response during the association period with a significant higher level in the LN group ; (c) shows the dissociation phase, with distinct slower koff values for LN and (d) shows the endpoint measurements with CLIA, with no significant correlation in level for LN compared to non-nephritis patients.
When kinetic parameters were analysed using area-under-the-curve (AUC) measurements, they correlated strongly with disease severity (SLE versus LN). In a subset of patients assessed at the time of kidney involvement diagnosis, before treatment initiation, antibody kinetics also associated with the NIH activity score* – while standard biological markers showed no such correlation.
Table 1: Discriminative relevance by kinetic parameters of LN and SLE, compared to CLIA
| ROC curves Area Under Curve (AUC) | Ratio Association/ Dissociation | Dissociation (koff) | Association (slope) | Endpoint (Bmax) | CLIA (conc.) |
| Lupus without nephritis vs lupus nephritis | 0,82 (p = 0,006) | 0,78 (p =0,017) | 0,75 (p= 0,033) | 0,75 (p = 0,029) | 0,71 (p = 0,064) |
From a biological perspective, this makes sense. High-affinity antibodies that bind DNA quickly and tightly are more likely to form immune complexes, deposit in tissues, and trigger inflammation — a key mechanism driving organ damage in lupus.
*National Institutes of Health activity score for assisting diagnosis.
Correlation of SPR kinetics with activity score in lupus nephritis
At the time of renal involvement diagnosis and prior to initiating treatment, five patients with LN underwent SPR kinetic assessments. Interestingly, an association was identified between the maximal binding response observed in SPR measurements and the NIH activity score (sr = 1, P < 0.05) (Figure 3). In contrast, no correlations were found between standard biological parameters (UPCR, haematuria or GFR*) and the NIH activity score (data not shown). Also, anti-dsDNA IgG levels measured by standard CLIA did not show correlation with the disease activity score (sr = −0.1, P = ns) (Figure 3).
*See table below
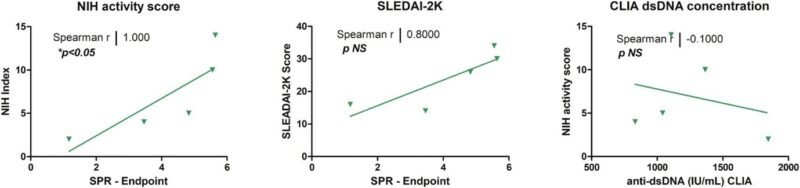
Figure 3: Correlation between SPR maximal binding response and disease activity in lupus nephritis patients. Data points represent individual patients; the solid line denotes the linear regression fit.
Implications for lupus care and research
This study marks a shift in how biomarkers in autoimmune disease are approached. Rather than relying solely on antibody concentration, it highlights the value of functional biomarkers that capture pathogenic potential by reflecting antibody behavior.
Key implications include:
- Earlier prognosis and improved monitoring: Affinity maturation may reveal disease progression before irreversible organ damage occurs.
- Non-invasive patient stratification: Antibody kinetics could help identify patients at higher risk of severe flares or organ involvement, reducing reliance on invasive procedures such as kidney biopsy.
- More informed treatment decisions: Kinetic profiles may support therapy selection, dosing strategies, and treatment response monitoring.
- Next-generation biomarker development: Moving beyond static antibody levels, functional immune profiling lays the groundwork for more precise, personalised approaches to disease management.
Overall, kinetic analysis of autoantibodies has the potential to become a valuable decision-support tool for both clinical management and therapeutic patient selection. In diseases as heterogeneous as SLE and lupus nephritis, this added layer of insight could meaningfully improve how patients are diagnosed, monitored, and treated.
Interested in learning more? Read the complete publication here: A novel surface plasmon resonance approach to assess anti‐dsDNA antibody kinetics and disease severity in systemic lupus erythematosus – Nagant – 2026 – Clinical & Translational Immunology – Wiley Online Library
Interested to learn how we can support you with affinity insights for your auto antibodies? Contact us and follow us on Linkedin for more interesting insights.
Table 2. Comparison of routine clinical parameters between non-nephritis and lupus nephritis patients. This table illustrates the comparative analysis of routine renal function parameters [median (IQR)] between non-nephritis lupus patients and lupus nephritis patients (Parameters shown in bold are statistically significant, * P<0.05.)
| Lupus without nephritis (n = 14) | Lupus nephritis (n = 12) | |
| UPCR (g g−1 creatinine) | 0.21 (0.06–0.35) | 0.37 (0.14–1.61) |
| Hematuria (cells μL−1) | 0 (0–2.75) | 8 (0–146)* |
| GFR (mL min−1 1.73m−2) | 90 (90–90) | 90 (81–90) |
| Plasma creatinine (mg dL−1) | 0.78 (0.69–0.80) | 0.70 (0.55–0.93) |
| Plasma albumin (g L−1) | 39.5 (37.0–42.3) | 37.0 (33.9–40.3) |
| Haemoglobin (g dL−1) | 12.2 (10.8–13.7) | 11.5 (10.4–12.6) |
| Anti-dsDNA IgG (UI mL−1) CLIA | 157.0 (46.8–328.0) | 1061 (124.4–1215) |